Tracing Routes through the Internet
If you've done any network troubleshooting, you've probably heard of the traceroute tool. It's a command-line utility that finds (traces) all the servers a packet of data will visit as it travels over the internet between your computer and some target server. For example, here's the route packets take from WonderProxy's server in London to our server in Lima, Peru:
traceroute to lima.wonderproxy.com (190.12.87.26), 30 hops max, 60 byte packets
 1  paradox.bitfolk.com (85.119.80.23)  0.061 ms  0.046 ms  0.034 ms
 2  jump-gw-4.lon.bitfolk.com (85.119.80.4)  0.422 ms  0.491 ms  0.571 ms
 3  vl368-ntt-thn-peer.jump.net.uk (194.153.169.185)  0.828 ms  0.881 ms  0.892 ms
 4  ae-0.level3.londen10.uk.bb.gin.ntt.net (129.250.9.126)  0.539 ms  0.517 ms  0.507 ms
 5  ae-227-3603.edge3.London15.Level3.net (4.69.167.98)  0.691 ms ae-225-3601.edge3.London15.Level3.net (4.69.167.90)  0.829 ms  0.577 ms
 6  ae-227-3603.edge3.London15.Level3.net (4.69.167.98)  0.797 ms  0.651 ms ae-226-3602.edge3.London15.Level3.net (4.69.167.94)  0.689 ms
 7  gblx-level3-50g.London15.Level3.net (4.68.110.158)  1.505 ms  1.419 ms  1.300 ms
 8  190.216.187.2 (190.216.187.2)  176.906 ms  176.929 ms  176.963 ms
 9  xe1-10-2.Lim1.opticalnetworks.pe (190.12.64.45)  189.991 ms  189.273 ms  189.198 ms
 10  * * *
 11  * * *
 12  * * *
 13  * * *
(etc.)
Hostnames, IP addresses, what looks like some sort of timing information in milliseconds at the end, and some random lines with just asterisks. Clear as mud! Let's break it down:
traceroute to lima.wonderproxy.com (190.12.87.26), 30 hops max, 60 byte packets
We're trying to hit lima.wonderproxy.com, which has an IP address of 190.12.87.26, with information packets that contain 60 bytes of dummy data. The 30 hops max bit is really the guts of traceroute. Here's what the official man page (man like manual, not like male person) says:
This program attempts to trace the route an IP packet would follow to some internet host by launching probe packets with a small ttl (time to live) then listening for an ICMP "time exceeded" reply from a gateway. We start our probes with a ttl of one and increase by one until we get an ICMP "port unreachable" (or TCP reset), which means we got to the "host", or hit a max (which defaults to 30 hops).
In other words, traceroute is able to trace a route by hacking around how the IP protocol works. As it travels around the internet, a packet will zip through lots of different servers (also known as routers) that tell it where to go next. Time to live is sort of a misnomer; it's really hops to live, or the number of routers this packet can travel through before it has to stop. If the packet expires (i.e. its time/hops to live runs out) while it's still traveling around, the last router it hits will complain to the origin with the time exceeded message. The 30 hops max is another way of saying max life 30.
So that's the intro! Let's look at the first line of results:
1 paradox.bitfolk.com (85.119.80.23) 0.061 ms 0.046 ms 0.034 ms
This is the first hop, with a TTL of 1, but what are those numbers at the end?
Three probes (by default) are sent at each TTL setting and a line is printed showing the TTL, address of the gateway and round trip time of each probe.
traceroute sends three packets for each "hop," so this line shows the results for three packets with a TTL of 1. Each of the three packets expired when it hit paradox.bitfolk.com, which has an IP address of 85.119.80.23. The first packet took 0.061 milliseconds to go out and come back, the second took 0.046 milliseconds, and the third took 0.034 milliseconds.
The next few lines show roughly the same thing, but with bigger TTL values:
 2  jump-gw-4.lon.bitfolk.com (85.119.80.4)  0.422 ms  0.491 ms  0.571 ms
 3  vl368-ntt-thn-peer.jump.net.uk (194.153.169.185)  0.828 ms  0.881 ms  0.892 ms
 4  ae-0.level3.londen10.uk.bb.gin.ntt.net (129.250.9.126)  0.539 ms  0.517 ms  0.507 ms
The 2-TTL packets hit jump-gw-4.lon.bitfolk.com, the 3-TTL packets hit vl368-ntt-thn-peer.jump.net.uk, and so on.
The 5-TTL packets went a little sideways:
5 ae-227-3603.edge3.London15.Level3.net (4.69.167.98) 0.691 ms ae-225-3601.edge3.London15.Level3.net (4.69.167.90) 0.829 ms 0.577 ms
Two routers on the same line! What?
If the probe answers come from different gateways, the address of each responding system will be printed.
One of the 5-TTL packets hit ae-227-3603.edge3.London15.Level3.net, and the other two packets hit ae-225-3601.edge3.London15.Level3.net. Both routers belong to Level3, which runs one of the biggest internet interchanges in the world. I don't know exactly how Level3 routers decide where to send a packet next, but in this case, the outcome was a little different. And that's ok! If I ran the same traceroute command again, I'd probably get slightly different routers at that hop.
The next four hops are similar to what we've seen so far:
 6  ae-227-3603.edge3.London15.Level3.net (4.69.167.98)  0.797 ms  0.651 ms ae-226-3602.edge3.London15.Level3.net (4.69.167.94)  0.689 ms
 7  gblx-level3-50g.London15.Level3.net (4.68.110.158)  1.505 ms  1.419 ms  1.300 ms
 8  190.216.187.2 (190.216.187.2)  176.906 ms  176.929 ms  176.963 ms
 9  xe1-10-2.Lim1.opticalnetworks.pe (190.12.64.45)  189.991 ms  189.273 ms  189.198 ms
The IP address of that last hop, 190.12.64.45, is really close to our target of 190.12.87.26. We're definitely in the neighborhood, but the rest of the hops are just asterisks and we never actually hit anything:
 10  * * *
 11  * * *
 12  * * *
 13  * * *
etc.
What happened to the rest of the route?
If there is no response within a 5.0 seconds (default), an "*" (asterisk) is printed for that probe.
More specifically, a * in the probe results means there's a server there, but it ignored us (or it didn't respond fast enough). It ate the expired packet silently, without sending us the ICMP time expired message. Lots of servers, like the server that might host your website, are configured to do that on purpose. (Whether that's a good idea or not is another topic, but it's covered pretty well elsewhere.)
So if an asterisk line means a server didn't respond, do the last lines of our output actually tell us anything useful? Sure:
- The 10-TTL packet hit a server
- The 11-TTL packet hit a server
- The 12-TTL packet hit a server
- The 13-TTL packet hit a server
- etc.
We have no idea if the remainder of the probes all hit the same server, or if they each hit a different server, or if there was some combination of those possibilities. All we know is that at TTLs 10 and higher, there's at least one server ignoring us.
That distinction got relevant for WonderProxy a few weeks ago. We're building a new monitoring platform on top of the Where's It Up API, called Observ.io. traceroute is one of the tools available in Observ.io for network troubleshooting and diagnostics. Observ.io displays traceroute results like this:
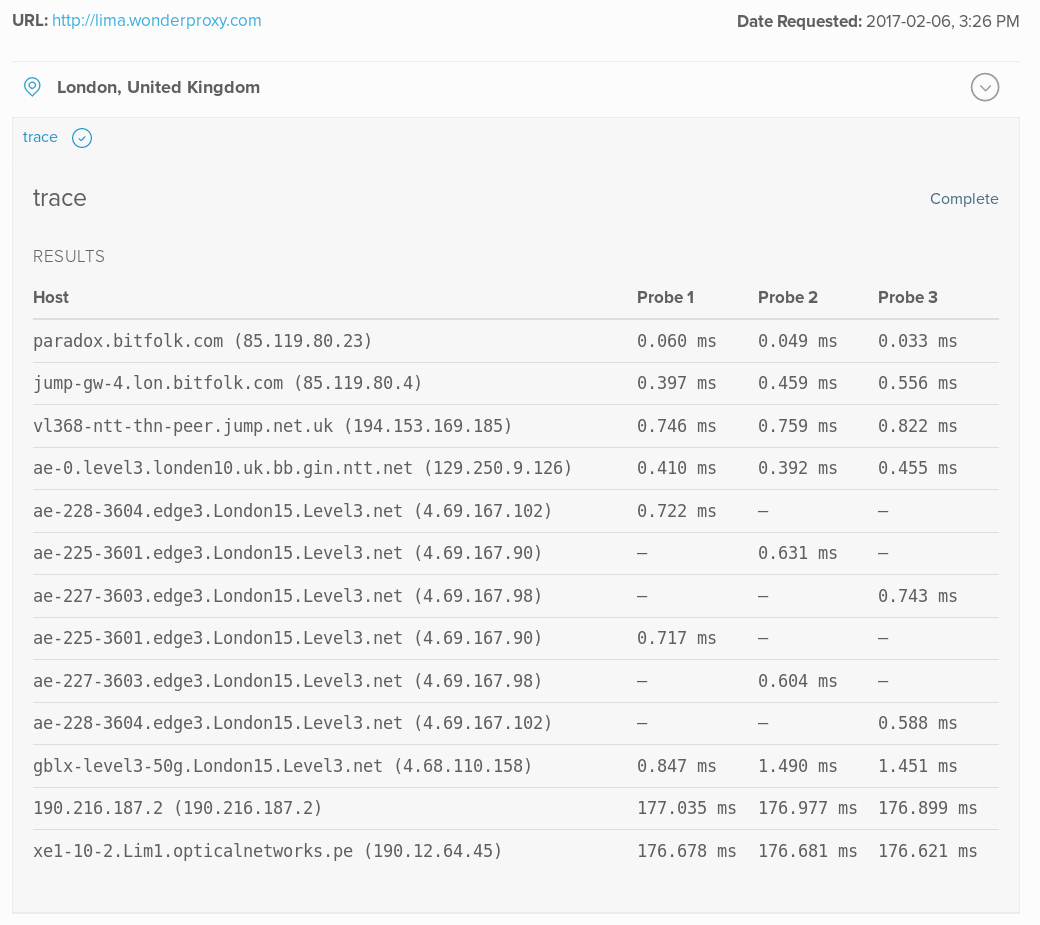
You can see the first three hops there are the same as our results, and the next few go a little sideways again. After the probes get off the Level3 exchange, the results stabilize. The last few probes are just like ours, except the asterisk lines are missing.
Observ.io is still missing a relevant piece of data: the TTL for each hop. It's not a critical piece of information, but it would help make the Level3 chaos a little more comprehensible. Look for that to show up in the weeks and months ahead (and if you want, track our progress)!