Monitoring the WonderProxy Network
It’s important to know the state of your network and to be quickly informed when something goes wrong. There are a number of independent pieces on each machine that ensure that our proxies work correctly, and we need to be able to make sure that they’re all working correctly. We currently use three tools to monitor our network: Cacti, Nagios, and Smokeping.
 Cacti
Cacti
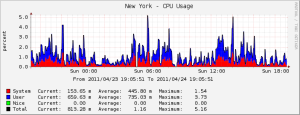
We’ve been using Cacti for quite a while, and it provides us with historical information about our proxies: CPU, Load, RAM, Bandwidth. This data allows us to see how well each of our proxies are handling the load of the customers and allows us to plan upgrades if necessary. Squid isn’t a very CPU intensive process, so even when our proxies are shuttling data at 1MB/s in and out the CPU isn’t particularly taxed.
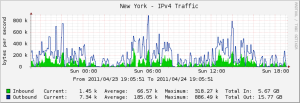

Nagios provides near real-time updates about the status of our network; it is the main source of status updates for our proxies. The information provided by Nagios is used to update the network status bar on our main page. We believe that our customers should be able to easily determine if something’s not working on their end or our end, so our main page is updated every minute with the current status of our proxies.
Our checking is currently centralized to one machine, so whether it can reach the proxy and properly authenticate may unfortunately not line up with what our customers see. However it does easily catch the cases where the machine is down or unreachable due to network issues at our host. There are also times where our monitoring machine decides it’s not happy and stops resolving hostnames which really makes our front page look sad. It doesn’t happen very often (4 times total I believe) and since it’s identical to one of our proxies that’s with the same host I’m at a bit of a loss as to what’s going wrong. If it happens again and I’m able to isolate the problem you can bet there will be a post about it!
When we first started using Nagios I installed the Debian package nagios-statd-server on all the proxies which would be periodically interrogated by the client on the monitoring machine. This worked fine for the most part, but every now and then the server on the proxy would get hung up and stop answering requests. As I upgraded our proxies to Debian Squeeze the problem got worse, and not being familiar with Python I didn’t really have any idea what could be going wrong. So I filed a bug against the Debian package since I couldn’t find an upstream.
Having the monitoring process regularly hang on our proxies wasn’t really sustainable so I went searching for another client/server program for Nagios and ended up with the nagios-nrpe-server which directly executes standard Nagios plugins. It has worked flawlessly since we switched many months ago. It appears that this is the preferred method of retrieving server statuses so I’m not sure how I stumbled across nagios-statd-server.
Smokeping provides us with a visualization of the latency between our monitoring host and our proxies around the world. We expect latency to grow in relation to the distance from the monitor to the proxy, but it doesn’t follow that packet loss should be expected. Smokeping can show us which of our proxies are likely experiencing network issues based on the packet loss and any spikes in latency. Unfortunately with some of our hosts there is a base level of packet loss so looking at the graphs isn’t always clear cut.
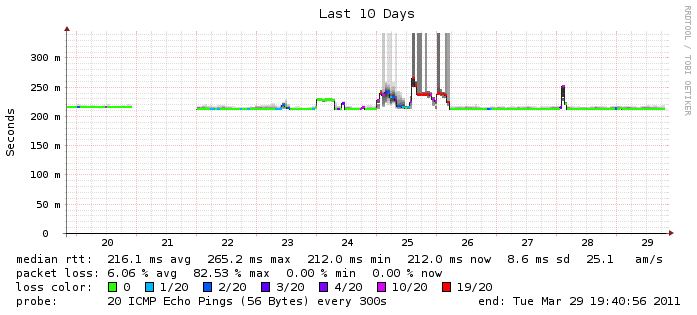
For most of our proxies, the graph above would be a relatively flat green line, but every now and again one of them has a bad day and we get colors!